on
Session Visualization with Obsidian
When working with coding agents such as Claude, Codex etc. we provide the prompts and context until we get to the final result. However a lot happens behind the scenes. The model constantly makes calls to tools, MCP servers, commands etc until it arrives at the output. By knowing what path it took, we can begin to understand its reasoning better.
One way I have found useful is to use pre/post hooks to log these messages into files and then use Obsidian to visualize them.
Obsidian is a note taking app which stores notes as files on your local disk. You can link notes together and then visualize them as a graph.
In order to demonstrate this, I used claude to create a sample todo app. I had claude generate a script which would log events for me into a folder of my choice (In Obsidian lingo, this folder is called a “vault”).
Before you start prompting Claude, you will have to update its settings.json file to call this script in the pre/post hooks:
|
|
Once this is ready, just prompt claude as you would. It will log all the events into the folder configured in your script. The events are logged into numbered files representing the thought process of the model.
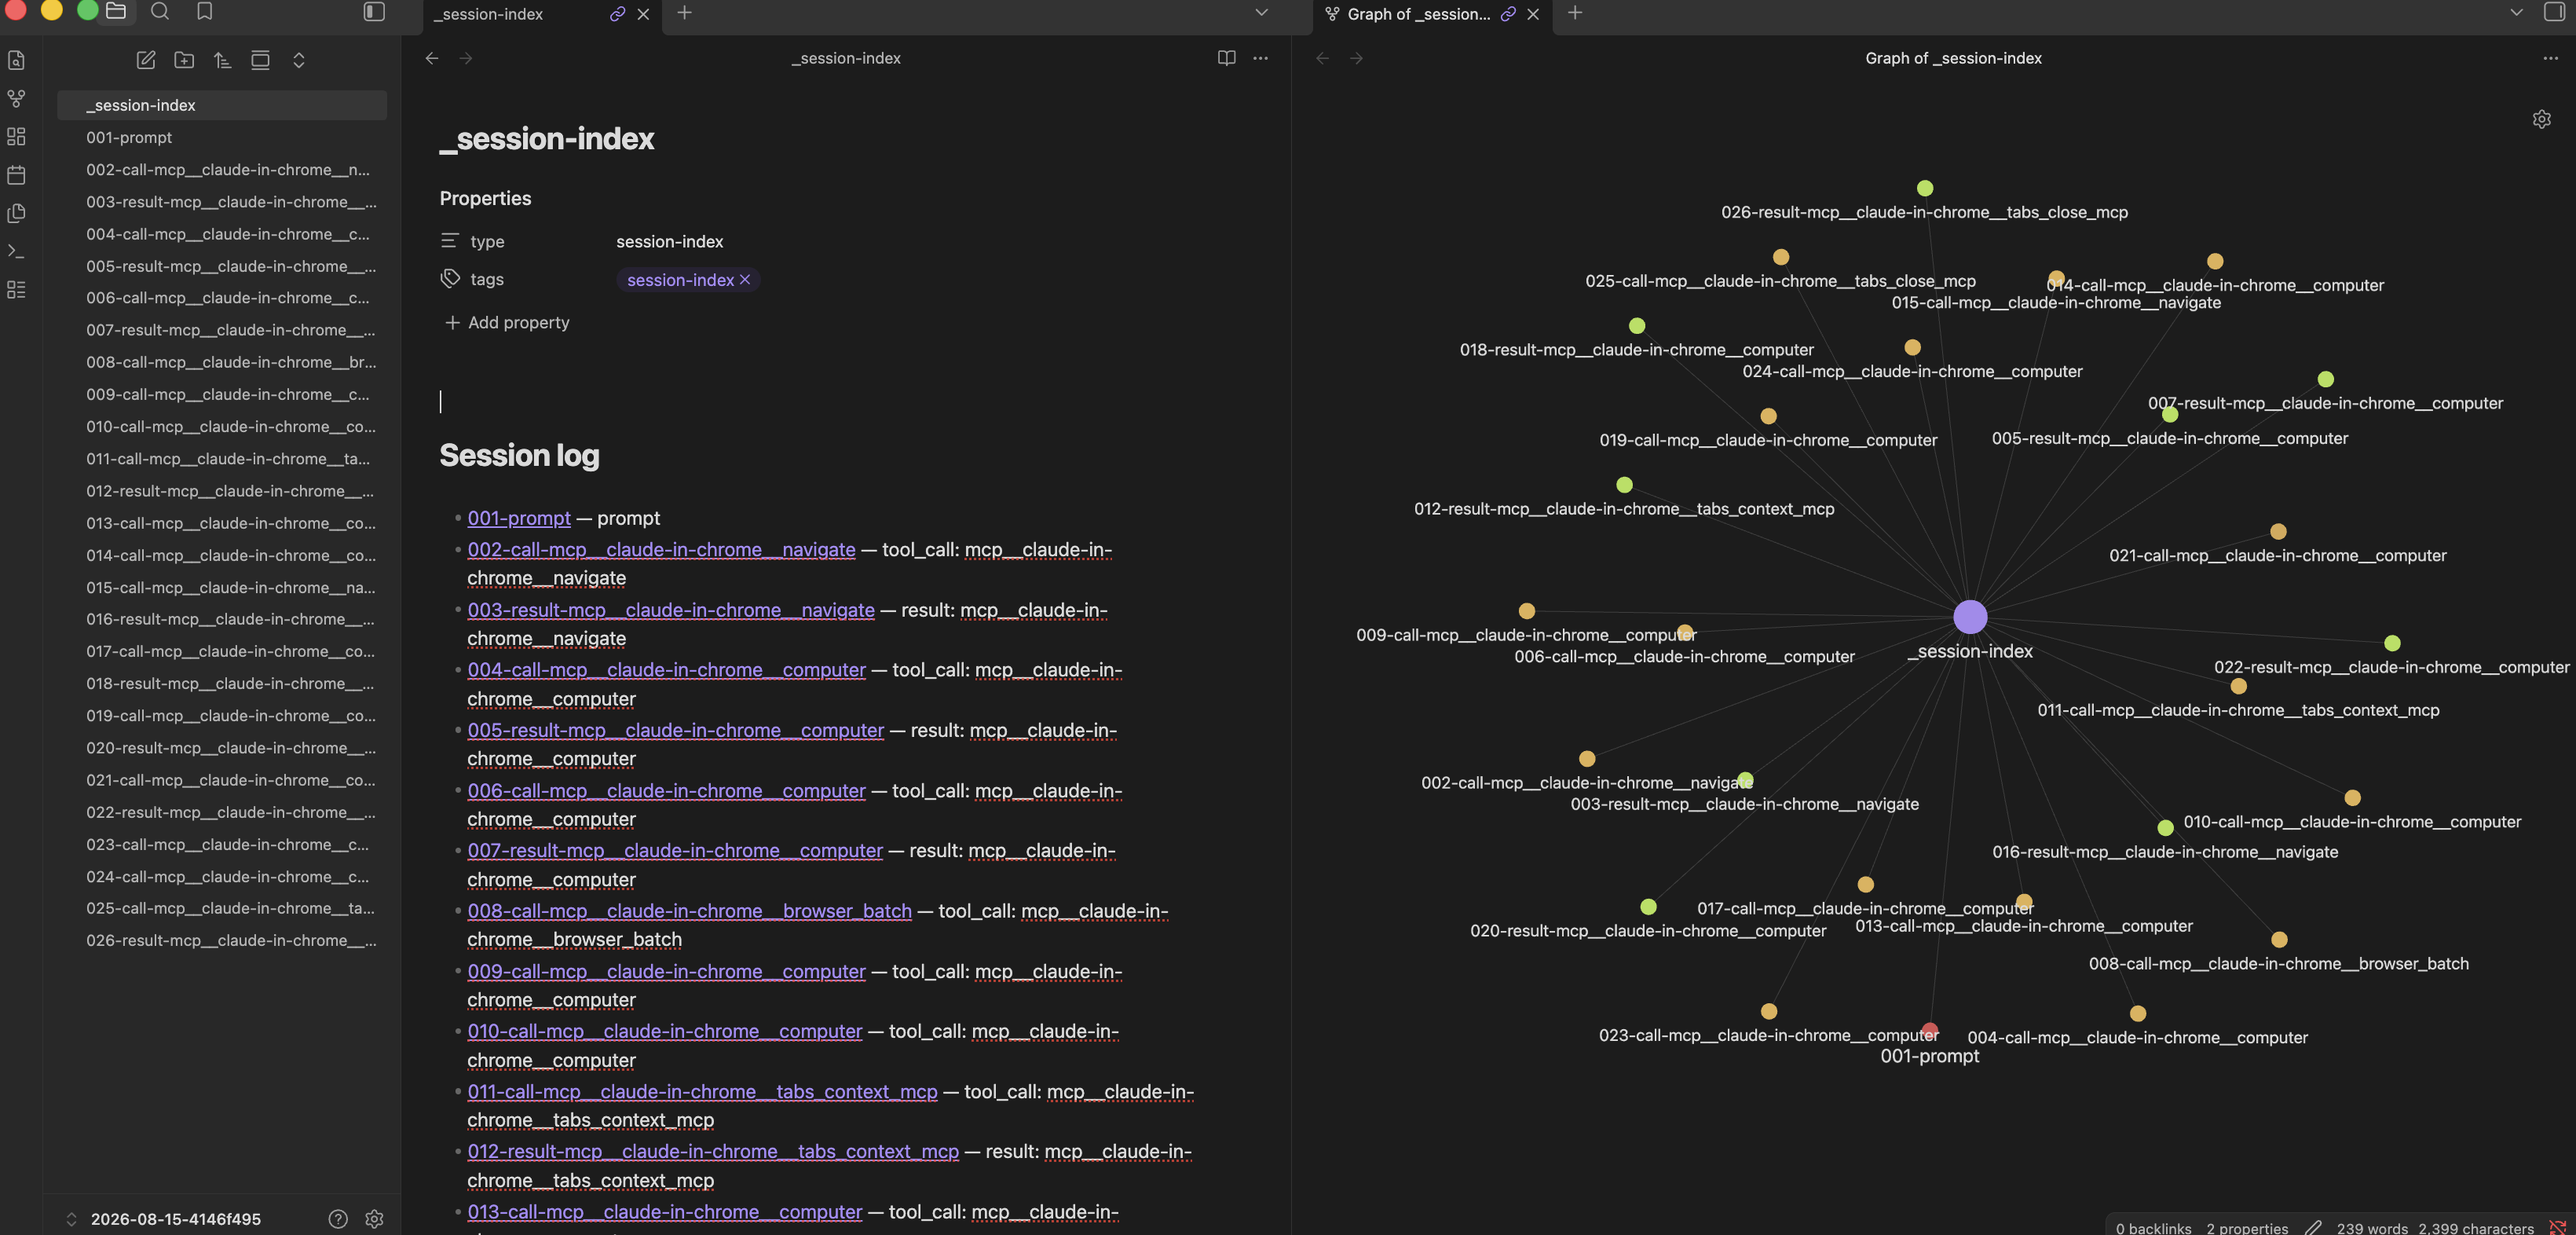
You can now see the visual representation of all the steps as to how the model arrived at the final result. You can also go sequentially through the files to understand them and see how the graph builds up.
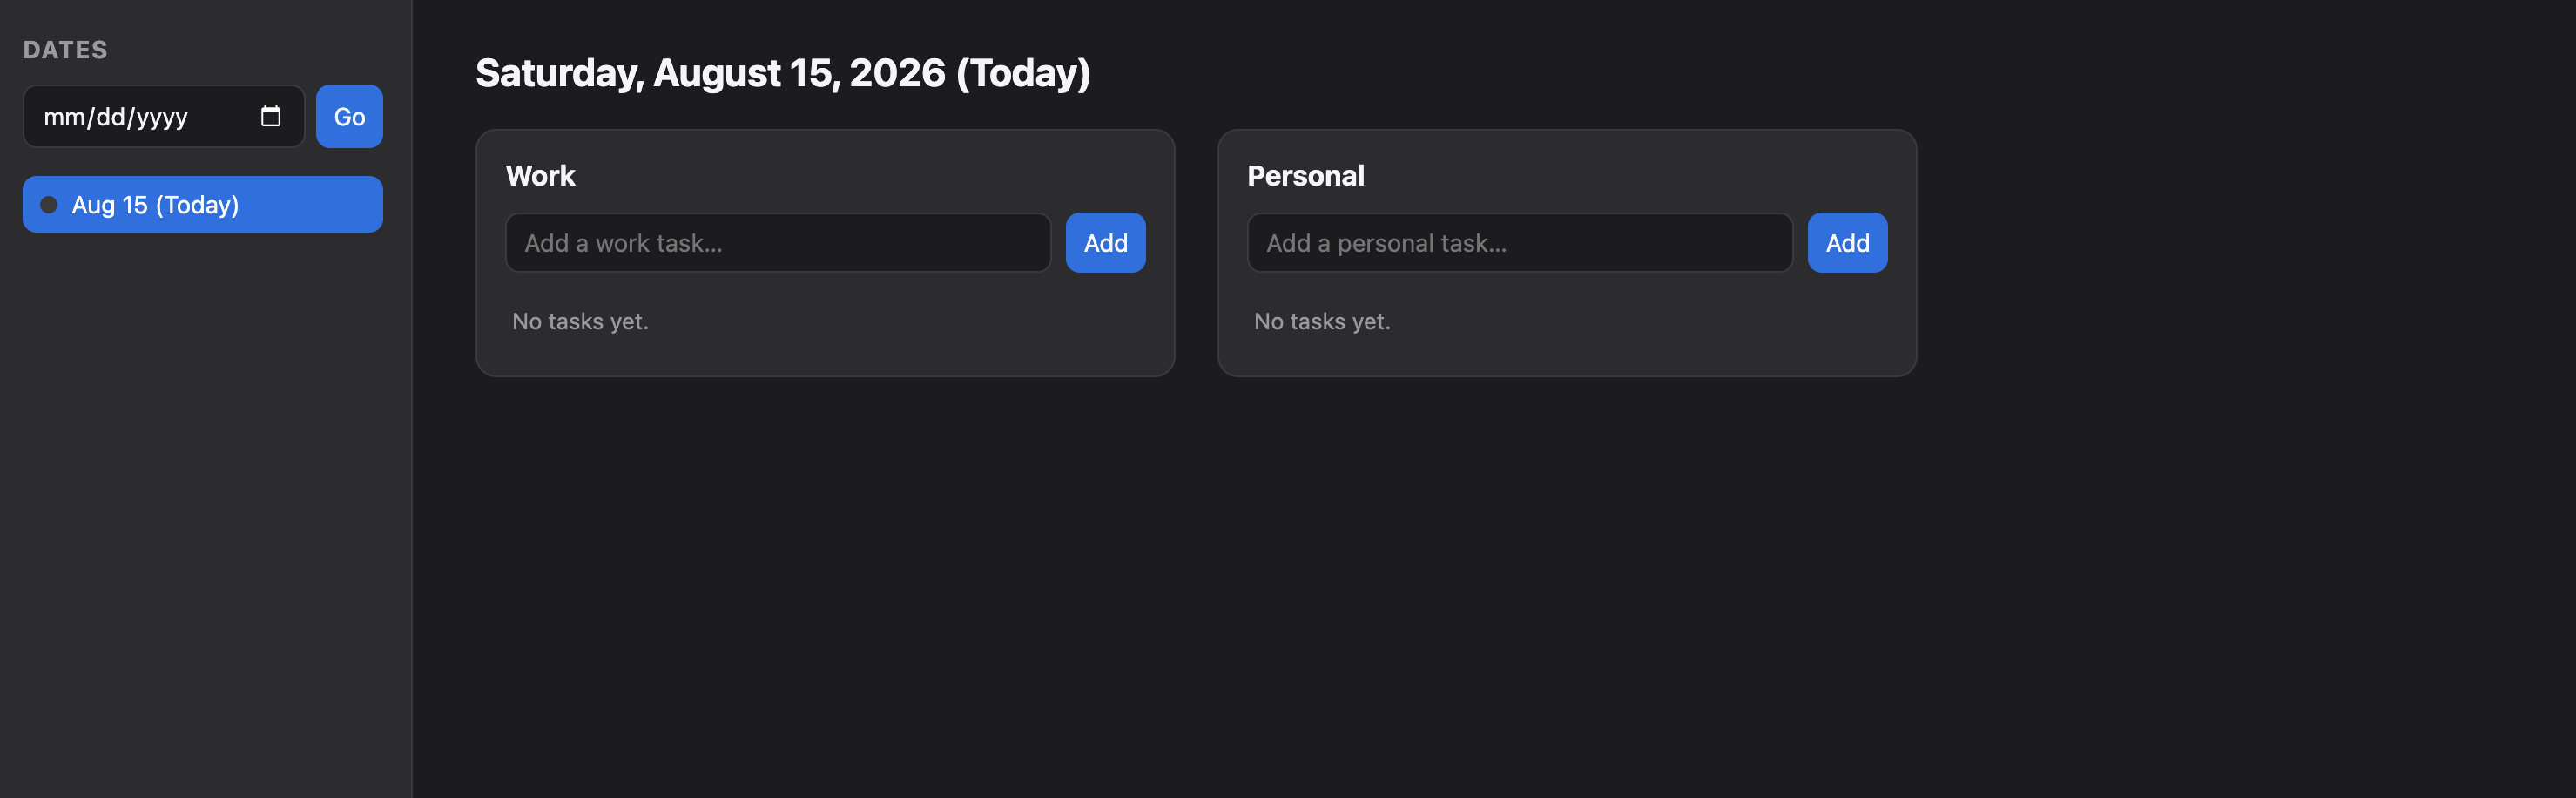
And here is the final todo app:
There may be other uses of keeping your session history around, but at least now you have them in an easy visualizable format !